
Last year at rstudio::conf(2022) Jeff Leek shared about the Data Trail program.
DataTrail is a no-cost, paid 14-week educational initiative for young-adult, high school and GED-graduates. DataTrail aims to equip members of underserved communities with the necessary skills and support required to work in the booming field of data science. DataTrail is a fresh take on workforce development that focuses on training both Black, Indigenous, and other people of color (BIPOC) interested in the data science industry and their potential employers.
We have been so excited then to have the opportunity to work with two Data Trail interns this year! Jabir Ghaffar went through the Data Trail program June 2022, and Davon Person went through the Data Trail program in 2019, and now works as a Data Programming Specialist with the project. Jabir and Davon worked on solutions for the R for Data Science book, explored some Tidy Tuesday datasets, created their own Quarto websites, and their perspectives helped us learn more about how our tools and documentation can better support emerging data scientists.
Jabir’s primary project was to work on the R for Data Science solutions. The R for Data Science, 2nd Edition was released in June 2023. In this edition there is a lot of new content, and revisions and additions to exercises. We saw that Jeffrey Arnold’s solutions to the 1st edition are such a useful resource for the community. Therefore, this project aimed to both create a similar resource for 2nd edition and serve as an educational resource for the interns to help sharpen their tidyverse and general data science skills.
Some learning highlights for Jabir included faceting (as a solution to overplotting), consistent code styling (which helps make the code more pleasing to read), and, making maps! Specifically, Jabir mentioned that he has always wondered “how did they do that?!” with maps and found them to be quite intimidating, so it was especially satisfying to create his first heatmap of US states and chance of getting a tornado (https://jabirghaffar.quarto.pub/jabir/posts/tornado_mapping_exploration). This was not just a satisfying visualization exercise, but also a great opportunity to dig into unfamiliar data wrangling functions like
recode() for converting 2-letter state abbreviations to state names.
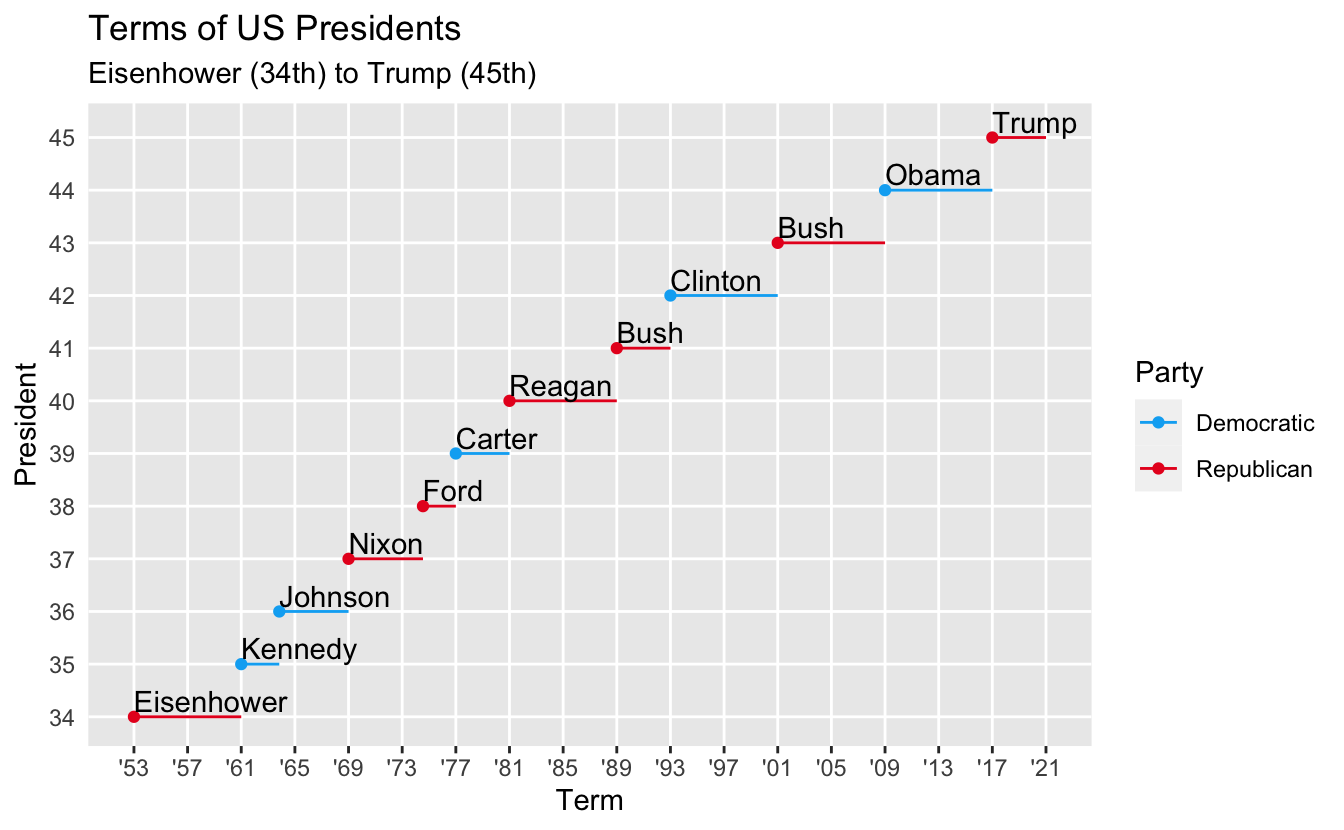
The exercises in R4DS range from quick, almost obvious, drills to ones that can really make you think and spin your wheels for a bit. One such exercise for Jabir was the one on changing the display of presidential terms from Section 12.4.6. The exercise asks:
Change the display of the presidential terms by:
- Combining the two variants that customize colors and x axis breaks.
- Improving the display of the y axis.
- Labelling each term with the name of the president.
- Adding informative plot labels.
- Placing breaks every 4 years (this is trickier than it seems!).
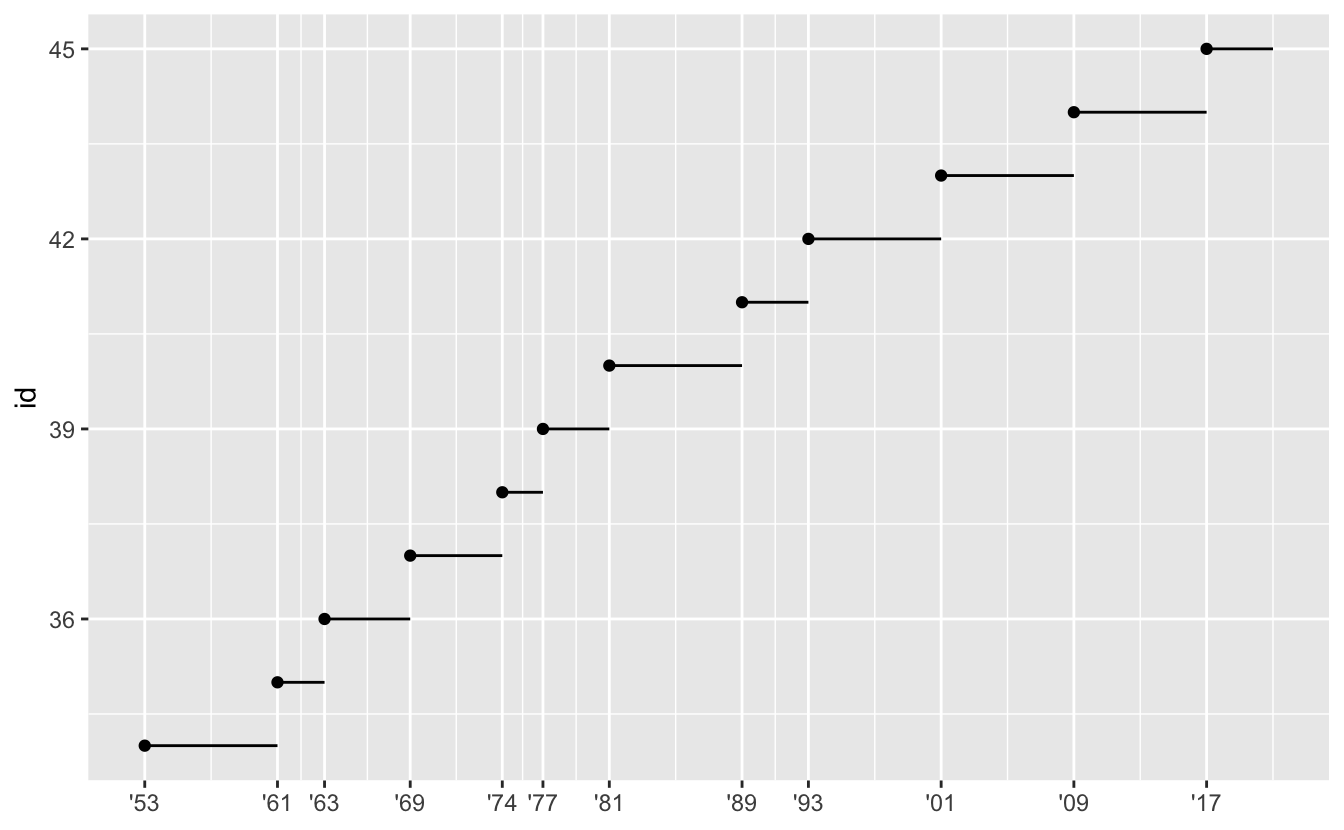
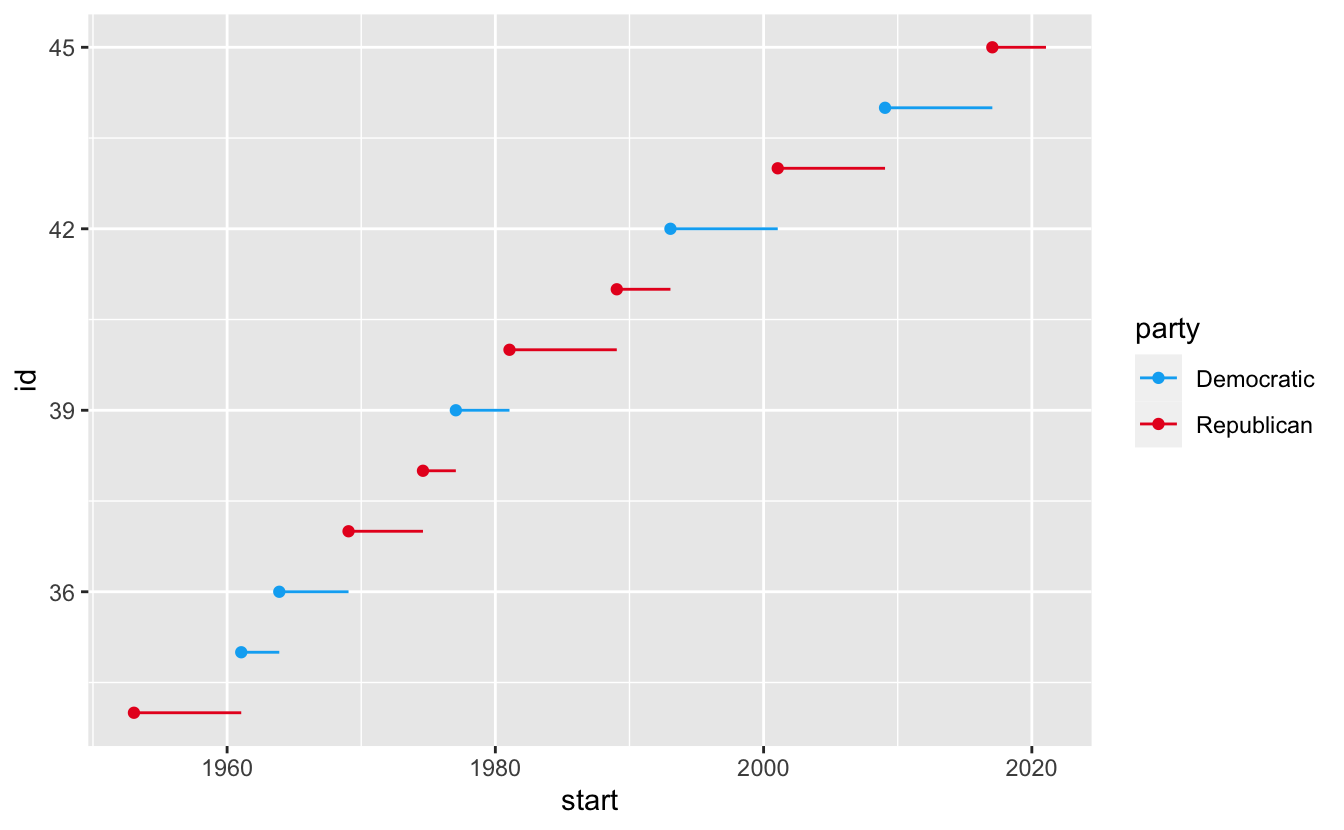
The starting points for the exercise are the following plots from the text:
library(tidyverse)

presidential |>
  mutate(id = 33 + row_number()) |>
  ggplot(aes(x = start, y = id)) +
  geom_point() +
  geom_segment(aes(xend = end, yend = id)) +
  scale_x_date(name = NULL, breaks = presidential$start, date_labels = "'%y")

presidential |>
  mutate(id = 33 + row_number()) |>
  ggplot(aes(x = start, y = id, color = party)) +
  geom_point() +
  geom_segment(aes(xend = end, yend = id)) +
  scale_color_manual(values = c(Republican = "#E81B23", Democratic = "#00AEF3"))
Jabir says “This question completely puzzled me. I’d say good luck, and if you’re new and you get to this question, I recommend you look at the solution manual.”
The first challenge was identifying where in the text the original plot was developed, and the code associated with it. And then, the most challenging part of this exercise was labeling the y-axis with the names of presidents. It took lots of Googling, but ultimately Jabir used suggestions from ChatGPT to get this over the finish line. And, perhaps, the frustrating and satisfying part is that the answer was pretty obvious in hindsight:
presidential <- presidential |>
  mutate(id = 33 + row_number())

ggplot(presidential, aes(x = start, y = id)) +
  geom_point(aes(color = party)) +
  geom_segment(aes(xend = end, yend = id, color = party)) +
  geom_text(aes(label = name), hjust = 0, vjust = 0, nudge_y = 0.1) +
  scale_color_manual(values = c(Republican = "#E81B23", Democratic = "#00AEF3")) +
  scale_x_date(
    name = "Term",
    breaks = seq(from = ymd("1953-01-20"), to = ymd("2021-01-20"), by = "4 years"),
    date_labels = "'%y"
  ) +
  scale_y_continuous(breaks = 34:45) +
  theme(
    panel.grid.minor = element_blank(),
    axis.ticks.y = element_blank()
  ) +
  labs(
    x = "Term",
    y = "President",
    title = "Terms of US Presidents",
    subtitle = "Eisenhower (34th) to Trump (45th)",
    color = "Party"
  )
Jabir felt like moments when he knew what to do and how to answer each question were very satisfying, but the moments where he felt stuck and went into rabbit holes looking for answers made him question whether he wanted to continue becoming a data scientist. Ultimately, though, the project was enjoyable, and not just a great learning experience for Jabir, but also a very meaningful one because it created a resource that can help future data scientists.
We felt like Jabir and Davon advanced their data science skills, and familiarity with working in open source, throughout the project. It was particularly exciting to see Jabir create his own data science portfolio as a Quarto website with posts on the Tidy Tuesday datasets, and we really appreciated his work on the R4DS Solutions. In going through those, he helped better refine the book, and created a resource that so many people are going to be able to use and learn from. We could see how he learned not just data science, but also grew as a leader who will continue to support others in their learning as he moves on to work as a developer with the Data Trail program. Davon too focused not just on data science, but was a part of our team, and the Data Trail team, providing mentorship to Jabir and bringing teaching approaches, like using Tidy Tuesday datasets, to his community. We are so grateful to have had the opportunity to work with them both, and see this as the beginning of continued collaborations.
Just like most open-source projects, the R4DS Solutions is a living and breathing project, still a work-in-progress. We would welcome any community contributions! All perspectives are important here, and it’s a great project if you’re a first-time contributor.