
We are hard at work finishing the next release of ggplot2. While this release is mostly about internal changes, there are a few quite user visible changes as well. One of these upends the idea that the size aesthetic is responsible for both the sizing of point/text and the width of lines. With the next release we will have a linewidth aesthetic to take care of the latter, while size will continue handling the former.
There are many excellent reasons for this change, all of which will have to wait until the release post to be discussed. This blog post is for those that maintain an extension package for ggplot2 and are left wondering how they should respond to this — if that is you, please read on!
The way it works
Before going into technicalities we’ll describe how it is intended to work. We are well aware that we can’t just make a change that would instantly break everyone’s code. So, we have gone to great length to make old code work as before while gently coercing users into adopting the new paradigm. For example, take a look at this old code:
library(ggplot2)

ggplot(airquality) +
  geom_line(
    aes(x = Day, y = Temp, size = Wind, group = Month),
    lineend = "round"
  )
#> size aesthetic has been deprecated for use with lines as of ggplot2 3.4.0
#> ℹ Please use linewidth aesthetic instead
#> This message is displayed once every 8 hours.
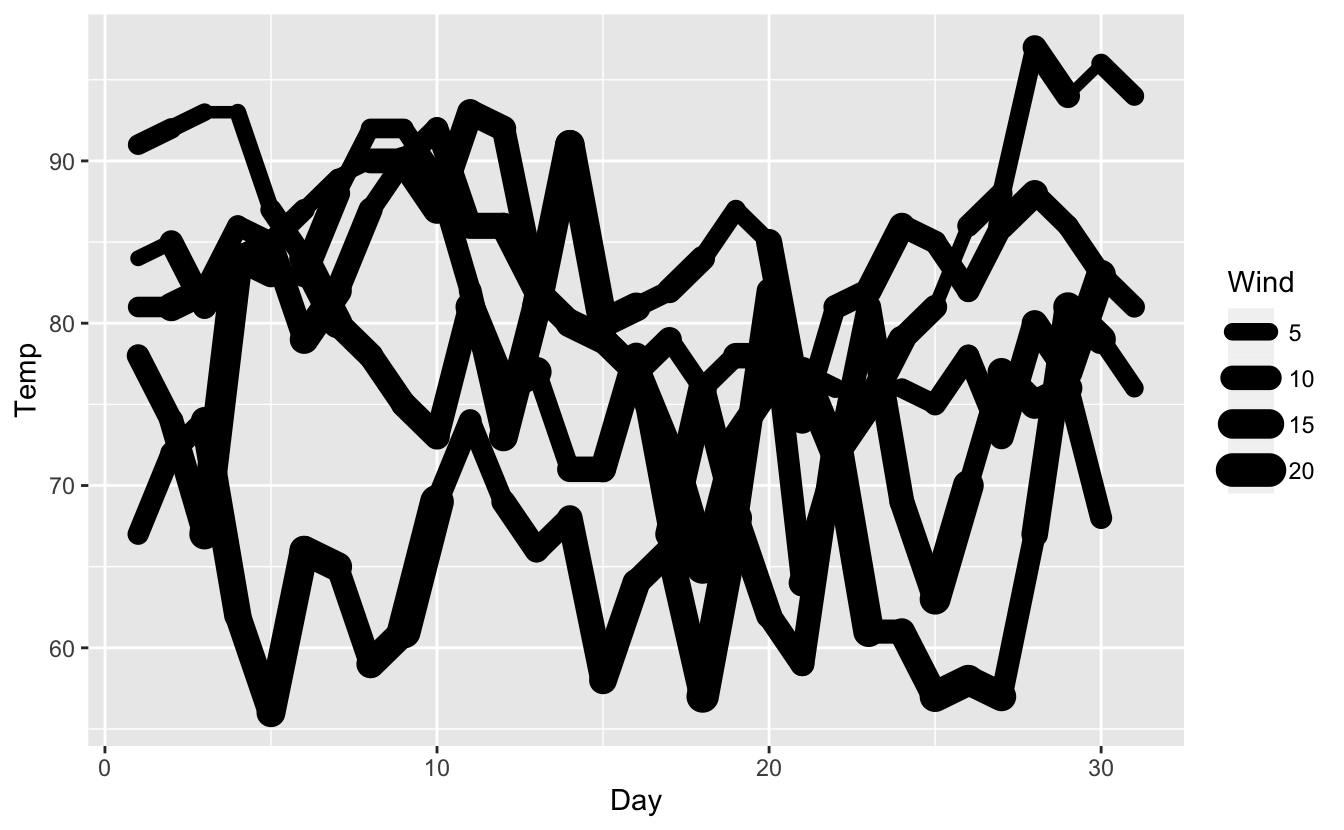
As you can see, ggplot2 detects the use of the size aesthetic and informs the user about the new linewidth aesthetic but otherwise proceeds as before, producing the expected plot. As expected,
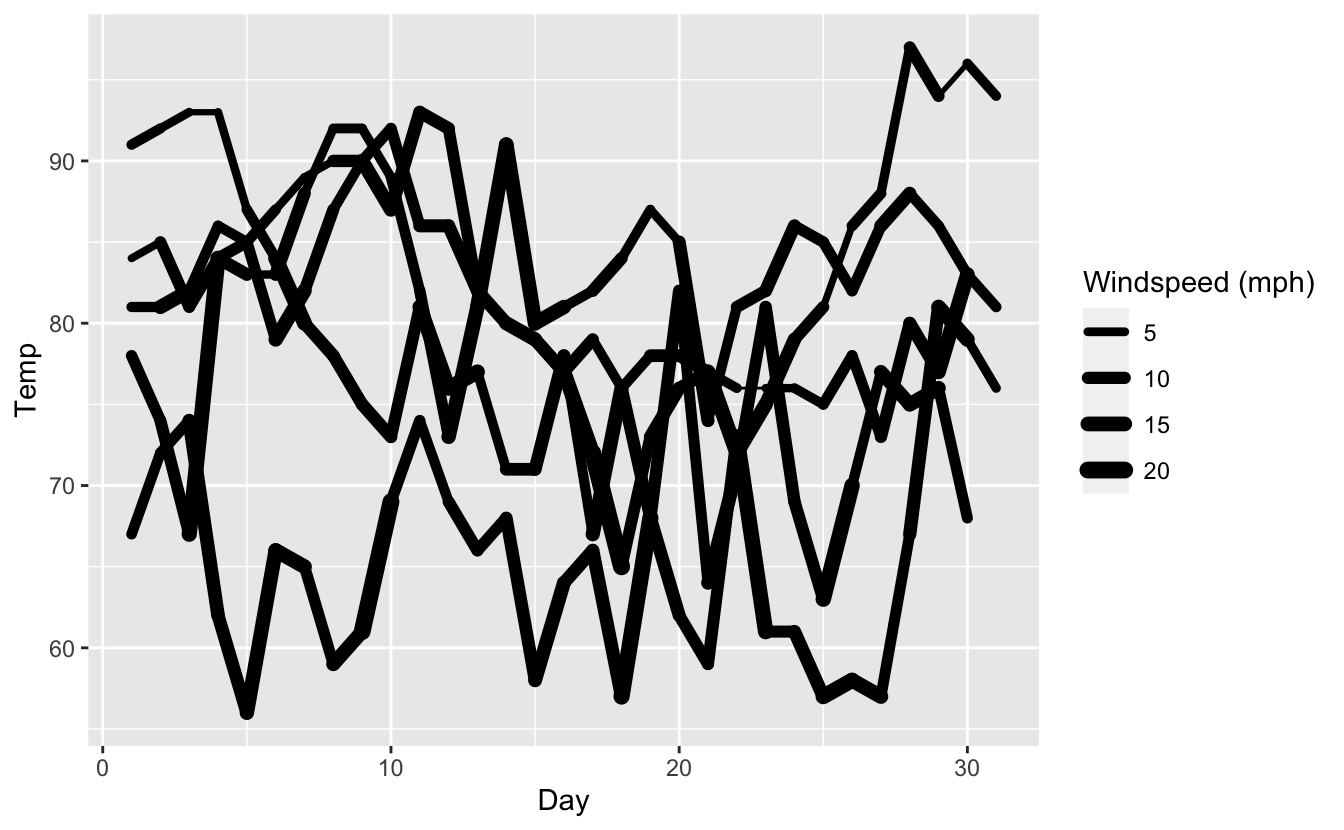
scale_size() also works in this situation:
ggplot(airquality) +
  geom_line(
    aes(x = Day, y = Temp, size = Wind, group = Month),
    lineend = "round"
  ) +
  scale_size("Windspeed (mph)", range = c(0.5, 3))
#> size aesthetic has been deprecated for use with lines as of ggplot2 3.4.0
#> ℹ Please use linewidth aesthetic instead
#> This message is displayed once every 8 hours.
but ultimately we want users to migrate to the following code:
ggplot(airquality) +
  geom_line(
    aes(x = Day, y = Temp, linewidth = Wind, group = Month),
    lineend = "round"
  ) +
  scale_linewidth("Windspeed (mph)", range = c(0.5, 3))
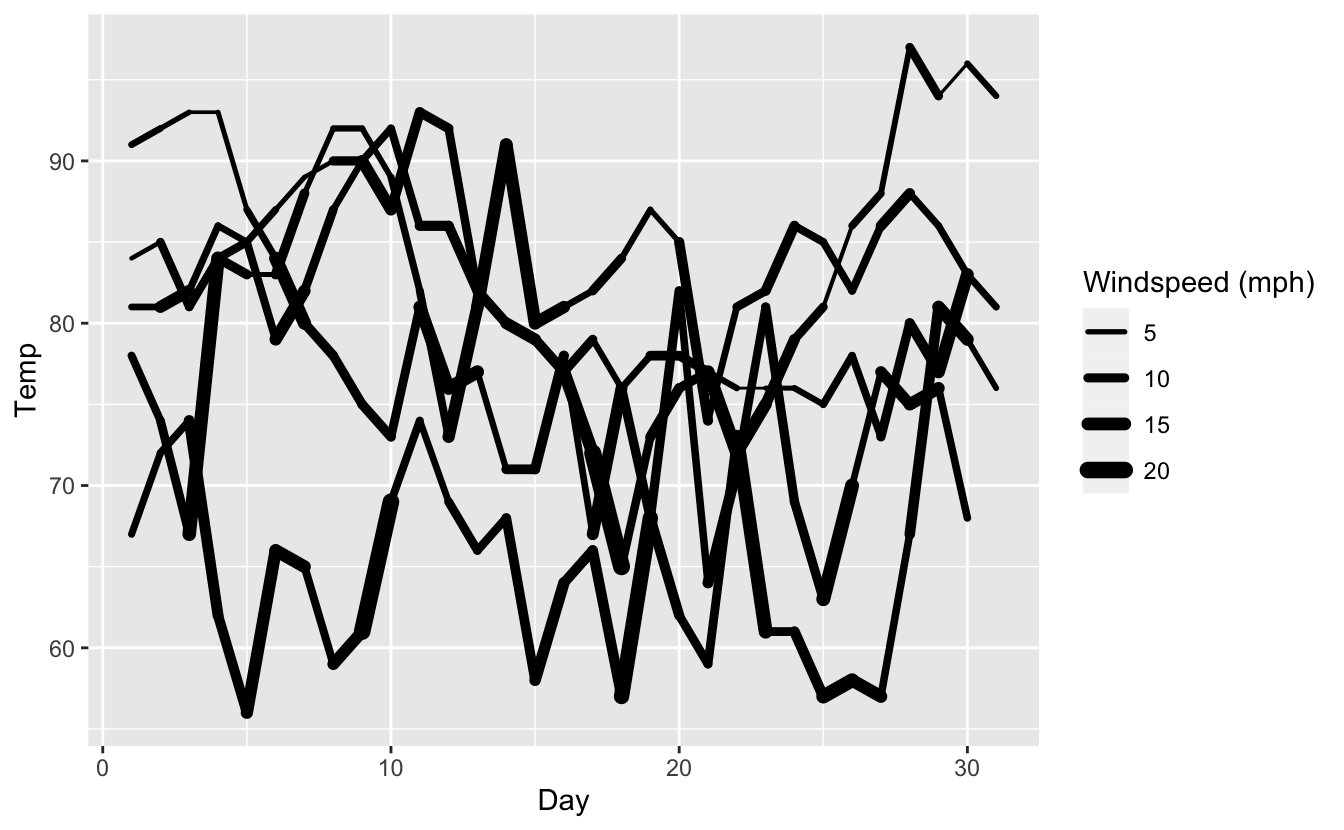
Note that there’s an important difference between these two plots (and one of the reasons we’re making the change): The last two plots differ because the default
linewidthscale correctly use a linear transform instead of a square root transform (which is only sensible for scaling of areas).
How to adopt this
We have been able to add this automatic translation in a quite non-intrusive way which means that you as a package developer don’t need to do that much to adapt to the new naming. To show this I’ll create a geom drawing circles then update it to use linewidth instead:
GeomCircle <- ggproto("GeomCircle", Geom,
  draw_panel = function(data, panel_params, coord) {
    # Expand x, y, radius data to points along circle
    circle_data <- Map(function(x, y, r) {
      radians <- seq(0, 2*pi, length.out = 101)[-1]
      data.frame(
        x = cos(radians) * r + x,
        y = sin(radians) * r + y
      )
    }, x = data$x, y = data$y, r = data$radius)

    circle_data <- do.call(rbind, circle_data)

    # Transform to viewport coords
    circle_data <- coord$transform(circle_data, panel_params)

    # Draw as grob
    grid::polygonGrob(
      x = circle_data$x,
      y = circle_data$y,
      id.lengths = rep(100, nrow(data)),
      default.units = "native",
      gp = grid::gpar(
        col = data$colour,
        fill = data$fill,
        lwd = data$size * .pt,
        lty = data$linetype
      )
    )
  },
  required_aes = c("x", "y", "radius"),
  default_aes = aes(
    colour = "black",
    fill = "grey",
    size = 0.5,
    linetype = 1,
    alpha = NA
  ),
  draw_key = draw_key_polygon
)

geom_circle <- function(mapping = NULL, data = NULL, stat = "identity",
                        position = "identity", ..., na.rm = FALSE,
                        show.legend = NA, inherit.aes = TRUE) {
  layer(
    data = data,
    mapping = mapping,
    stat = stat,
    geom = GeomCircle,
    position = position,
    show.legend = show.legend,
    inherit.aes = inherit.aes,
    params = list(
      na.rm = na.rm,
      ...
    )
  )
}
As a sanity check, let us check that this actually works:
random_points <- data.frame(
x = runif(20),
y = runif(20),
radius = runif(20, max = 0.1),
value = runif(20)
)
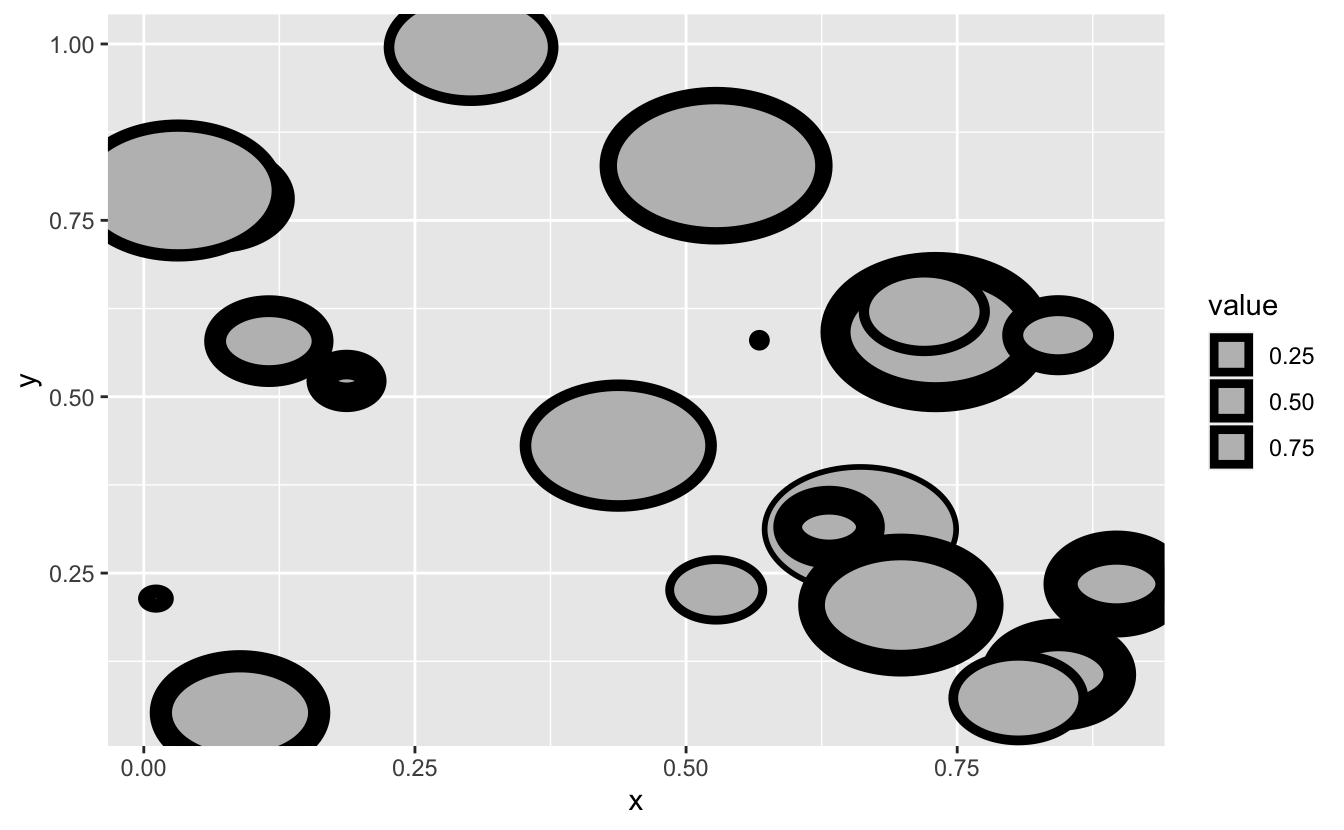
ggplot(random_points) +
geom_circle(aes(x = x, y = y, radius = radius, size = value))
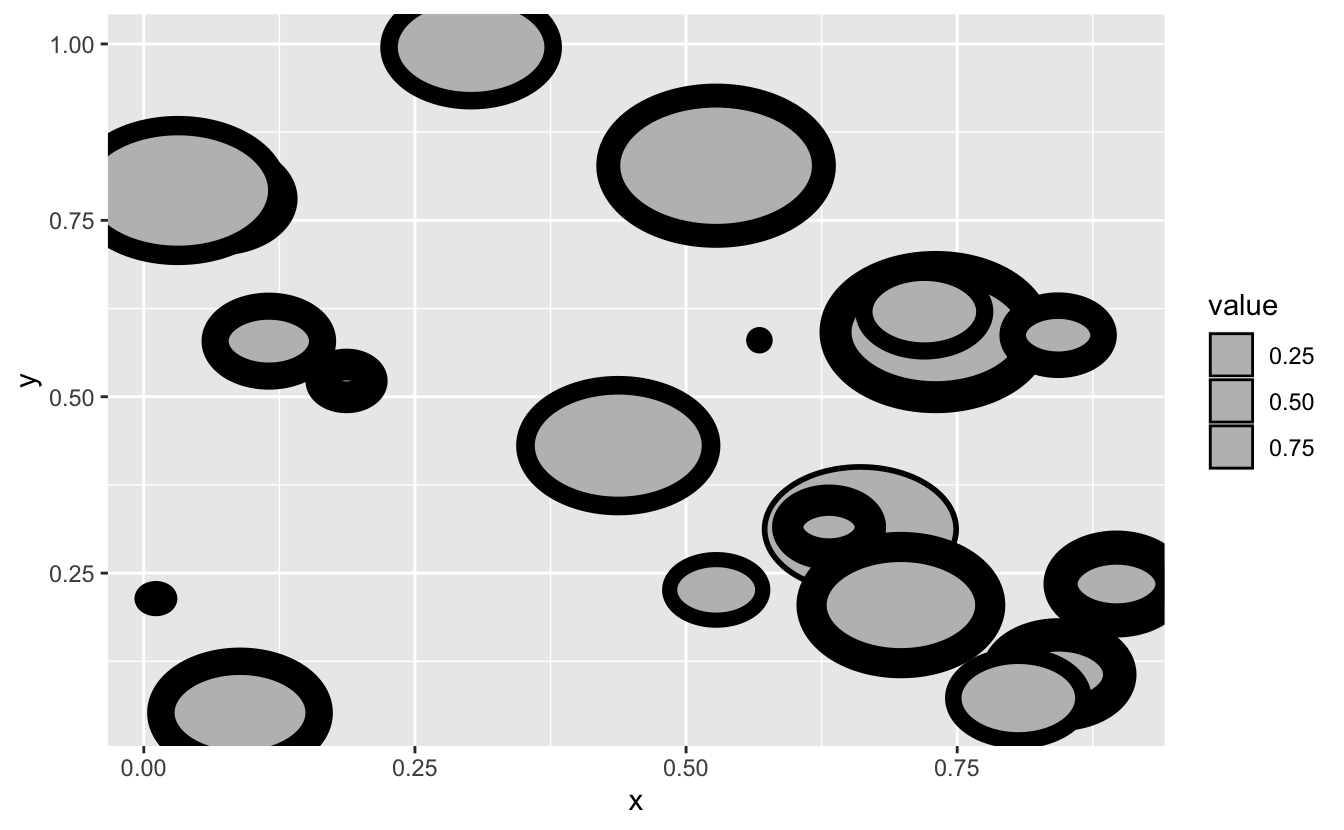
It seems to work as intended. As can be seen from the code above, the size aesthetics is not used much and is passed directly into polygonGrob(). It follows that updating the code to using linewidth is not a huge operation.
There is nothing preventing you from keeping the code as is — it will continue to work as always. However, your users may begin to feel a disconnect with the style as they adapt to the new
linewidthaesthetic so it is highly recommended to make the proposed changes
The fix
There are a few things you need to do to update the old code but they are all pretty benign. The changes are commented in the code below and will also be discussed afterwards.
GeomCircle <- ggproto("GeomCircle", Geom,
  draw_panel = function(data, panel_params, coord) {
    # Expand x, y, radius data to points along circle
    circle_data <- Map(function(x, y, r) {
      radians <- seq(0, 2*pi, length.out = 101)[-1]
      data.frame(
        x = cos(radians) * r + x,
        y = sin(radians) * r + y
      )
    }, x = data$x, y = data$y, r = data$radius)

    circle_data <- do.call(rbind, circle_data)

    # Transform to viewport coords
    circle_data <- coord$transform(circle_data, panel_params)

    # Draw as grob
    grid::polygonGrob(
      x = circle_data$x,
      y = circle_data$y,
      id.lengths = rep(100, nrow(data)),
      default.units = "native",
      gp = grid::gpar(
        col = data$colour,
        fill = data$fill,
        # Use linewidth or fall back to size in old ggplot2 versions
        lwd = (data$linewidth %||% data$size) * .pt,
        lty = data$linetype
      )
    )
  },
  required_aes = c("x", "y", "radius"),
  default_aes = aes(
    colour = "black",
    fill = "grey",
    # Switch size to linewidth
    linewidth = 0.5,
    linetype = 1,
    alpha = NA
  ),
  draw_key = draw_key_polygon,
  # To allow using size in ggplot2 < 3.4.0
  non_missing_aes = "size",

  # Tell ggplot2 to perform automatic renaming
  rename_size = TRUE
)
As we can see above, we need two changes and two additions to our implementation. First (but last in the code), we add rename_size = TRUE to our geom implementation. This instructs ggplot2 that this layer has a size aesthetic that should be converted automatically with a deprecation warning. Setting this to TRUE allows you to rest assured that as far as your code goes you can expect to have a linewidth aesthetic. Second, we update the default_aes to use linewidth instead of size. Third, wherever we use size in our geom logic we instead use linewidth %||% size. The reason for the fallback is that if your package is used together with an older version of ggplot2 the rename_size = TRUE line has no effect and you need to fall back to size if that is what the user has specified. Fourth, we add size to the non_missing_aes field. As with the last point, this is only relevant for use with older versions of ggplot2 as it instructs the geom to not warn when size is used.
Let’s try out the new implementation:
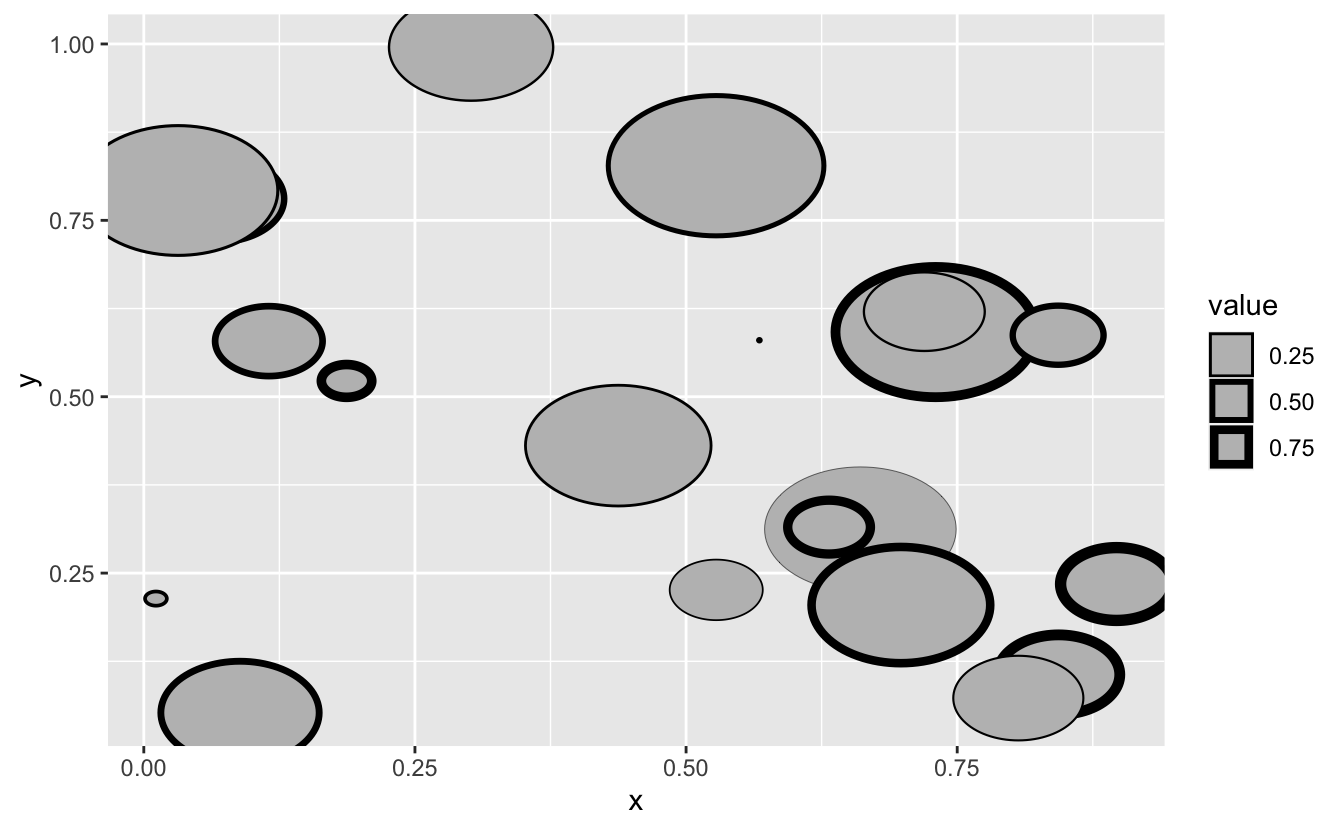
ggplot(random_points) +
  geom_circle(aes(x = x, y = y, radius = radius, size = value))
#> size aesthetic has been deprecated for use with lines as of ggplot2 3.4.0
#> ℹ Please use linewidth aesthetic instead
#> This message is displayed once every 8 hours.

We see that we get the deprecation warning we know and that everything also renders as expected. Using the new naming also works, picks up the linear linewidth scale, and doesn’t have a warning.
The legend looks a bit wonky, but that is because the polygon key function caps the linewidth at a certain size relative to the size of the key. We can see that it works fine using a lower range:
last_plot() + scale_linewidth(range = c(0.1, 2))
FAQ
I’m creating a geom as a subclass of one of the ggplot2 geoms that now uses linewidth — what should I do?
If your geom inherits from e.g.
geom_polygon() which in the next version will begin using linewidth all you have to do is to update your code to refer to linetype instead of size if it uses that anywhere. Your geom will already inherit the correct rename_size value.
I’m creating a stat — should I do anything?
Probably not. The only exception is if you set size in default_aes to a calculated value and the expectance is that the geom used with the stat will change to using linewidth. In such situations you should change the default_aes setting to use linewidth instead. We haven’t had any such situations in the ggplot2 code base so the chance of this being relevant is pretty low.
I’m creating a geom that uses size for both point sizing and line width — how should I proceed?
If you have a geom where size doubles for both point sizes and linewidth (an example from ggplot2 is
geom_pointrange()) you shouldn’t set rename_size = TRUE since size remains a valid aesthetic. However, you should add linewidth to default_aes and use this wherever in your code size was used for linewidth scaling before. Do note that this is a breaking change for your users since the same piece of code may no longer produce the same output.