We’re thrilled to announce the release of scales 1.1.0. The scales package provides much of the infrastructure that underlies ggplot2’s scales, and using it allow you to customize the transformations, breaks, and labels used by ggplot2. Get the latest version with:
install.packages("scales")
The biggest improvements in this release are related to usability and documentation:
Axis breaks and labels have a new naming scheme: functions that generate breaks from limits are called
breaks_; functions that generate labels from breaks are calledlabels_.All the examples for breaks and labels have been overhauled to use new
demo_continuous(),demo_discrete(), anddemo_log10(). These make it much easier to see how you’d use scales functions with ggplot2, so when you’re browsing the documentation, you can immediately see how the functions work with ggplot2.
library(scales)
There are also a few new breaks and labels functions:
New
breaks_width()allows you to specify the distance between breaks rather than the number of them.demo_continuous(c(0, 100), breaks = breaks_width(10)) #> scale_x_continuous(breaks = breaks_width(10))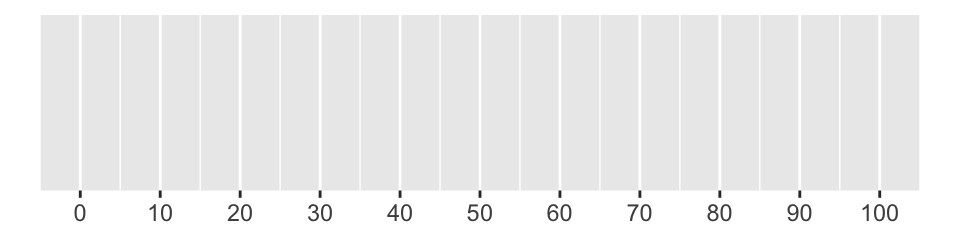
label_number()andlabel_percent()do a better job of picking the defaultaccuracy, which means that you should generally get the correct number of decimal place by default.demo_continuous(c(0, 0.1), labels = label_number()) #> scale_x_continuous(labels = label_number())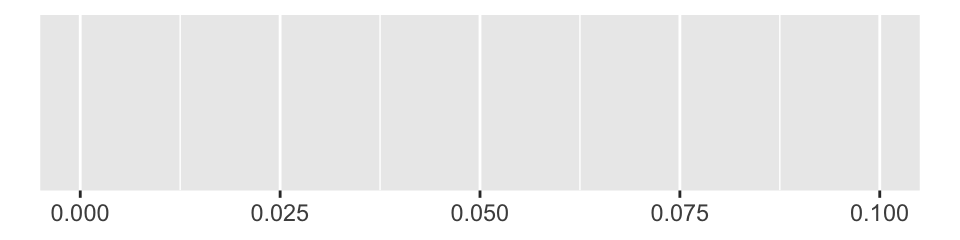
demo_continuous(c(0, 0.1), labels = label_percent())
#> scale_x_continuous(labels = label_percent())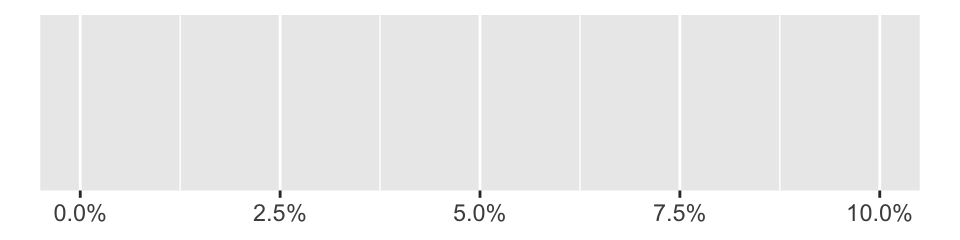
New
label_bytes()replacesnumber_bytes_format()with a more convenient interface. It takes a singleunitargument which can either be an SI unit (e.g. “kB”), a binary unit (e.g. “kIB”), or an automatic unit (either “auto_si” or “auto_binary”).# default is "auto_si" demo_continuous(c(1, 1e6), label = label_bytes()) #> scale_x_continuous(label = label_bytes())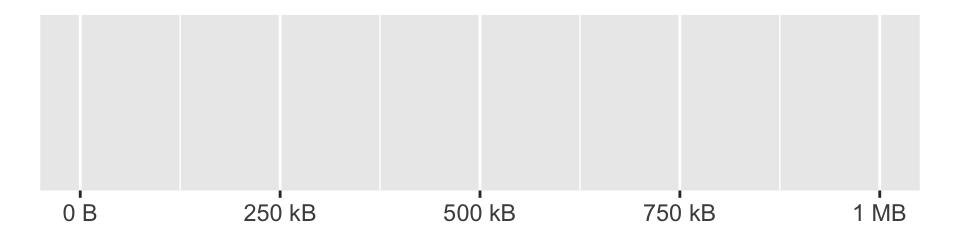
# supply a unit if you want all labels to use the same unit
demo_continuous(c(1, 1e6), label = label_bytes("kB"))
#> scale_x_continuous(label = label_bytes("kB"))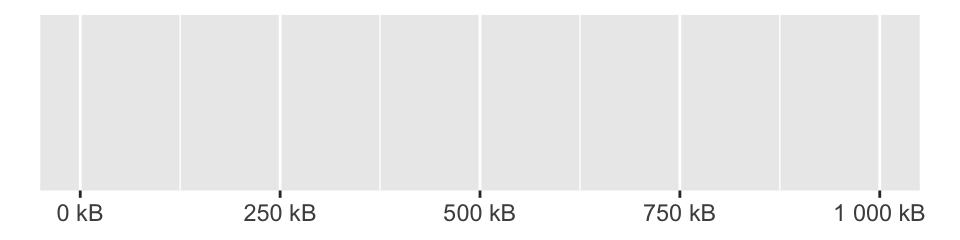
New
label_number_auto()automatically picks betweenlabel_number()andlabel_scientific()based on the range of the input. It should produce compact labels over a very wide range of inputs. We are considering making this the default labeller for a future version of ggplot2.demo_continuous(c(1, 1e5), labels = label_number_auto()) #> scale_x_continuous(labels = label_number_auto())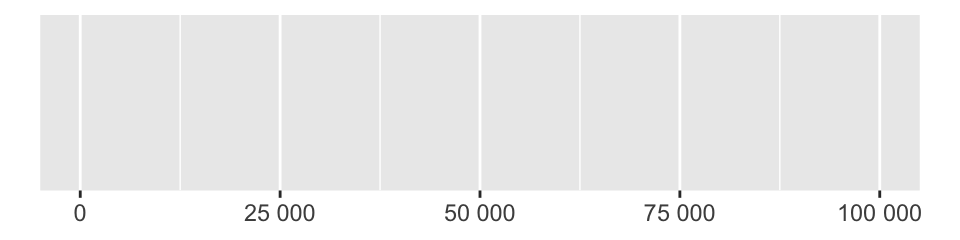
demo_continuous(c(1, 1e10), labels = label_number_auto())
#> scale_x_continuous(labels = label_number_auto())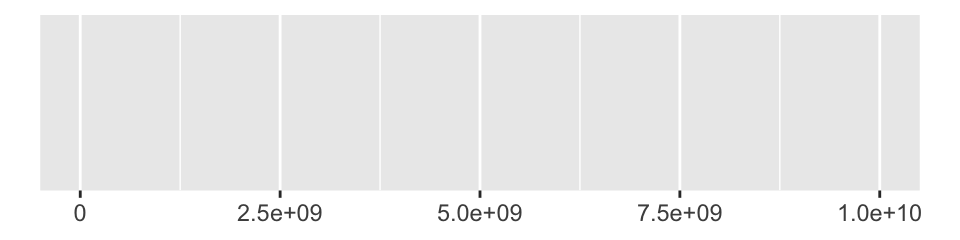
New
label_number_si()formats numeric vectors with SI units.demo_continuous(c(1, 1e9), label = label_number_si()) #> scale_x_continuous(label = label_number_si())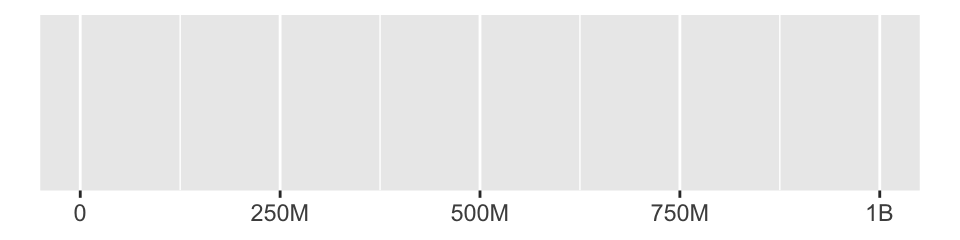
demo_log10(c(1, 1e9), breaks = log_breaks(10), labels = label_number_si())
#> scale_x_log10(breaks = log_breaks(10), labels = label_number_si())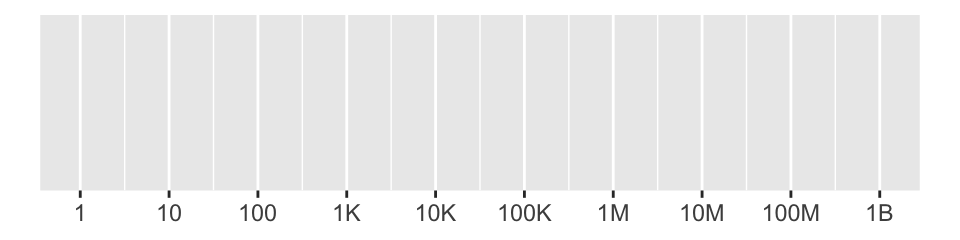
New
label_date_short()creates labels for a date axis that only show the components of the date that have changed since the previous label.five_months <- as.POSIXct(c("2019-11-01", "2020-03-01")) demo_datetime(five_months) #> scale_x_datetime()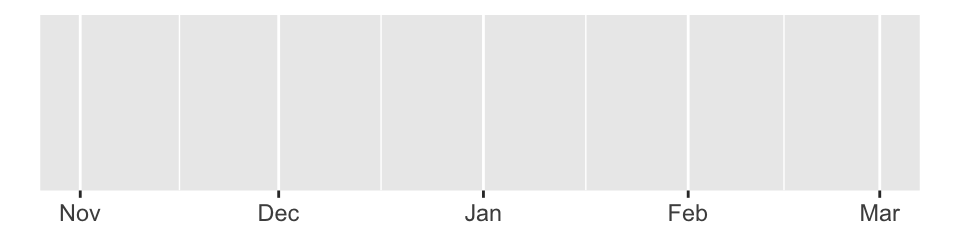
demo_datetime(five_months, labels = label_date_short())
#> scale_x_datetime(labels = label_date_short())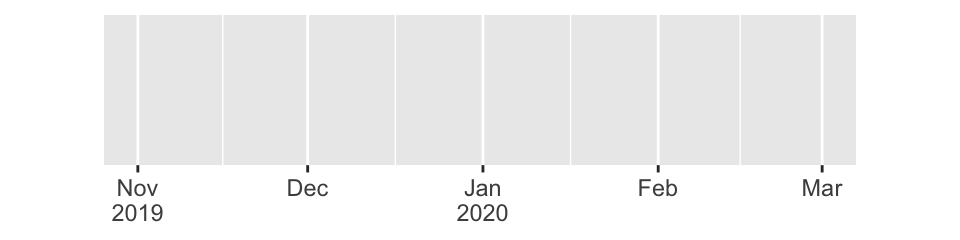
See the change log for a full list of changes and bug fixes in this version.
Acknowledgements
A big thanks to all the GitHub contributors who helped make this release happen! @agila5, @Anirudhsekar96, @apsalverda, @b-lev, @bhogan-mitre, @billdenney, @bjedwards, @bkkkk, @blairj09, @clauswilke, @const-ae, @davidmasp, @dpseidel, @eliocamp, @GegznaV, @hadley, @HenrikBengtsson, @hvaret, @jcheng5, @kiernann, @kuriwaki, @mikmart, @njtierney, @paleolimbot, @sada1993, @schloerke, @sflippl, @slowkow, @sobrietie, @tdawry, @teramonagi, @thomasp85, @topepo, @tungmilan, @turgeonmaxime, @wibeasley, @woodwards, and @zamorarr.