
It depends - A dialog about dependencies
This post paraphrases my talk with the same name at rstudio::conf 2019.
Software dependencies can be a double-edged sword.
On one hand, they let you take advantage of others’ work, giving your software marvelous new features and reducing bugs.
On the other hand, they can change over time, causing your software to break unexpectedly and (potentially) increasing your maintenance burden. They can also take additional disk space and installation time.
These downsides have led some to suggest a ‘dependency zero’ mindset.
We feel that this is a major mistake for most projects, and will instead increase maintenance burden, lower functionality and introduce additional bugs.
Dependencies are not equal
One issue with striving for minimal dependencies is it treats all dependencies as equivalent. However, in reality this is far from the case. There are many axes upon which dependencies can differ, but some of the most important include:
The type of the dependency. Some dependencies come bundled with R itself (e.g. base, utils, stats) or are part of the ‘Recommended’ packages (e.g. Matrix, survival). These packages are very low cost to depend on, as they are (nearly) universally installed on all users systems, and change generally only with new R versions. In contrast dependencies can also come from CRAN or even from non-CRAN repositories such as Bioconductor, Omegahat or drat which require users to configure additional repositories before installation.
The number of upstream dependencies. For example, the rlang package has no upstream dependencies apart from R; while the CNVscope package has 125 upstream dependencies, on both CRAN and Bioconductor.
Already fulfilled dependencies. If your package depends on dplyr then taking an additional dependency on tibble comes at no additional cost, as dplyr itself already depends on tibble. Additionally some of the most popular packages (e.g. ggplot2) will already be installed on the majority of users’ machines. So adding a ggplot2 dependency is unlikely to incur additional installation costs in most cases.
The time taken to compile the package from source. Packages containing R code generally install in roughly the same amount of time, but those that contain C, C++ or Fortran code can take very different amounts of time depending on the complexity of the code. For example, the glue package takes ~5 seconds to compile on CRAN’s build machines, whereas the readr package takes ~500 seconds to install on the same machines.
The size of the built binary package. Users installing binary packages need to download them, so the size of the built binary is relevant, particularly for those with slow internet connections. This also varies a great deal across packages. The awspack binary is only 8.6 Kb in size, while the h2o package is 123 Mb, and the largest binary on Bioconductor is over 4 Gb!
The system requirements to build and use the package. Some packages require additional system dependencies in order to be used. For instance, the rgdal package requires the GDAL and PROJ.4 dependencies, each of which in turn have additional system dependencies. Another example is rJava which requires a Java SDK and also has additional steps needed to configure R for the proper Java installation, which has caused installation issues for many people.
I hope the above examples illustrate that not all package dependencies are equal, and we should not treat them as such by using a simple count of dependencies as our metric.
Prefer a holistic, balanced and quantitative approach
Instead of striving for a minimal number of dependencies, I would instead suggest a more holistic, balanced, and quantitative approach.
A holistic approach looks at the project as a whole and asks who is the primary audience? If the audience is other package authors, then a leaner package with fewer dependencies may be more appropriate. If instead it is primarily data scientists or statisticians they will likely already have many popular dependencies installed and a more feature-full package is preferred.
A balanced approach understands that adding (or removing) dependencies come with trade-offs. Adding a dependency gives you additional features, bug fixes, and real-world testing, at the costs of increased installation time, disk space and maintenance if the dependency has breaking changes. In some cases it makes sense to increase dependencies for a package, even if an implementation already exists. For instance base R has a number of different implementations of non-standard evaluation with varying semantics across its functions. The same used to be true of tidyverse packages as well, but now they all depend on the implementations in the tidyselect and rlang packages, which improves consistency of the feature substantially.
In contrast, removing a dependency lowers installation time, disk space and avoids potential breaking changes. However it also removes potential features, increases bugs and takes additional development time.
A quantitative approach lets you more accurately measure your dependencies, and see which are heavier or lighter along various axes. Measuring each of the dependencies gives you more power to reason about which dependencies would be most beneficial to remove (if any).
How you weigh these costs and benefits varies by the skills and experience of the maintainer and the goals of the project.
Beware illusory superiority
When making these decisions it is important to consider the psychological phenomenon of Illusory Superiority. Illusory superiority is the idea that people (regardless of background) overestimate (sometimes greatly) their own abilities in a given field. No one is truly immune to this phenomenon, including the author of this post! This phenomenon will cause you to overestimate your ability to re-implement features, and underestimate the introduction of new bugs.
However, even if you truly are a more skilled programmer than the maintainer of a dependency, we would still advise caution. The existing package has the significant benefits of time and users. Users who have undoubtedly uncovered numerous bugs using the package in the real world, which are now fixed.
itdepends, a package to help with dependencies
The itdepends package aids you in having a holistic, balanced and quantitative approach. It provides tools to assess usage, measure weights, visualize proportions and if needed, assist removal of dependencies.
Assess usage with itdepends::dep_usage()
dep_usage_proj() and dep_usage_pkg() return a tibble of
every function call in your project or package. This information can then be
used to do things like
- show which packages you are using the most in a project
library(tidyverse)
itdepends::dep_usage_pkg("ggplot2") %>%
  count(pkg, sort = TRUE)
#> # A tibble: 23 x 2
#>    pkg           n
#>    <chr>     <int>
#>  1 base      10333
#>  2 ggplot2    1225
#>  3 grid        313
#>  4 scales      118
#>  5 gtable       78
#>  6 rlang        68
#>  7 plyr         53
#>  8 stats        44
#>  9 utils        24
#> 10 grDevices    20
#> # … with 13 more rows
- show the most frequently used function from each package
itdepends::dep_usage_pkg("ggplot2") %>%
  group_by(pkg) %>%
  count(fun) %>%
  top_n(1) %>%
  arrange(desc(n)) %>%
  head()
#> Selecting by n
#> # A tibble: 6 x 3
#> # Groups:   pkg [6]
#>   pkg     fun                 n
#>   <chr>   <chr>           <int>
#> 1 base    <-               1627
#> 2 grid    unit              101
#> 3 ggplot2 waiver             99
#> 4 gtable  gtable_add_grob    30
#> 5 scales  alpha              17
#> 6 utils   head               12
Measure weights with itdepends::dep_weight()
dep_weight() weighs the supplied packages and returns a tibble of 24
different metrics that can be used to compare them. The most important metric
varies by person, so it is useful to examine the full spectrum.
weights <- itdepends::dep_weight(c("dplyr", "data.table"))
weights
#> # A tibble: 2 x 25
#>   package num_user bin_self bin_user install_self install_user  funs
#>   <chr>      <int>    <int>    <dbl>        <dbl>        <dbl> <int>
#> 1 dplyr         21  1821891 23147844        272.         436.    260
#> 2 data.t…        0  6222622  6222622         29.5         29.5   108
#> # … with 18 more variables: downloads <dbl>, last_release <dttm>,
#> #   open_issues <int>, last_updated <dttm>, stars <int>, forks <int>,
#> #   first_release <dttm>, total_releases <dbl>, releases_last_52 <int>,
#> #   num_dev <int>, install_dev <dbl>, bin_dev <dbl>, src_size <int>,
#> #   user_deps <list>, dev_deps <list>, self_timings <list>,
#> #   user_timings <list>, dev_timings <list>
The measures break down into a few rough categories:
- package and repository information (
package,funs,downloads,open_issues,last_updated,forks,stars) - dependency information (
num_users,num_dev,user_deps,dev_deps) - compiled binary sizes (
bin_self,bin_user,bin_dev) - time to compile dependencies, and the raw times (
install_self,install_user,install_dev,self_timings,user_timings,dev_timings) - CRAN release information (
downloads,first_release,last_release,total_releases,releases_last_52)
The total number of dependencies, binary sizes, and installation times give you a good idea the magnitude of the dependency load.
Equally important, however, are the downloads, release information and open issues, which tell you how long the package has existed, how many people are using it and how many open issues exist. Packages that have existed longer, with more users and fewer issues should generally be more reliable.
Visualize proportions with itdepends::dep_plot()
There are two functions available to plot the relative weights of dependencies.
dep_plot_time()plots the median compilation time on CRAN’s servers.
itdepends::dep_plot_time("dplyr")

From the above plot we see that the installation time of dplyr for users is mostly due to compiling dplyr itself. However, for development dependencies, the readr, stringi and RSQLite packages also take significant time to install.
dep_plot_size()plots the pre-compiled binary size, which is often the more useful measure, as most users install pre-compiled binaries.
itdepends::dep_plot_size("dplyr")

From this we see the largest user dependencies are BH and Rcpp, and the largest development dependencies are stringi, and two data packages, Lahman and nycflights13.
Assist removal with itdepends::dep_locate()
If you do decide that a given dependency is too heavy or is too unstable to keep, what are the best practices for removing it?
First carefully review the operation of the function you are replacing. Many functions in CRAN packages appear superficially similar to base equivalents, but often handle edge cases (that you’ve likely never encountered) more consistently. Next and most importantly, write tests for the existing behavior. This is an essential step which will greatly reduce the introduction of new bugs. Only once you have written the tests should you start performing the replacement. If you are porting a function with existing tests a good practice is to port its tests as well.
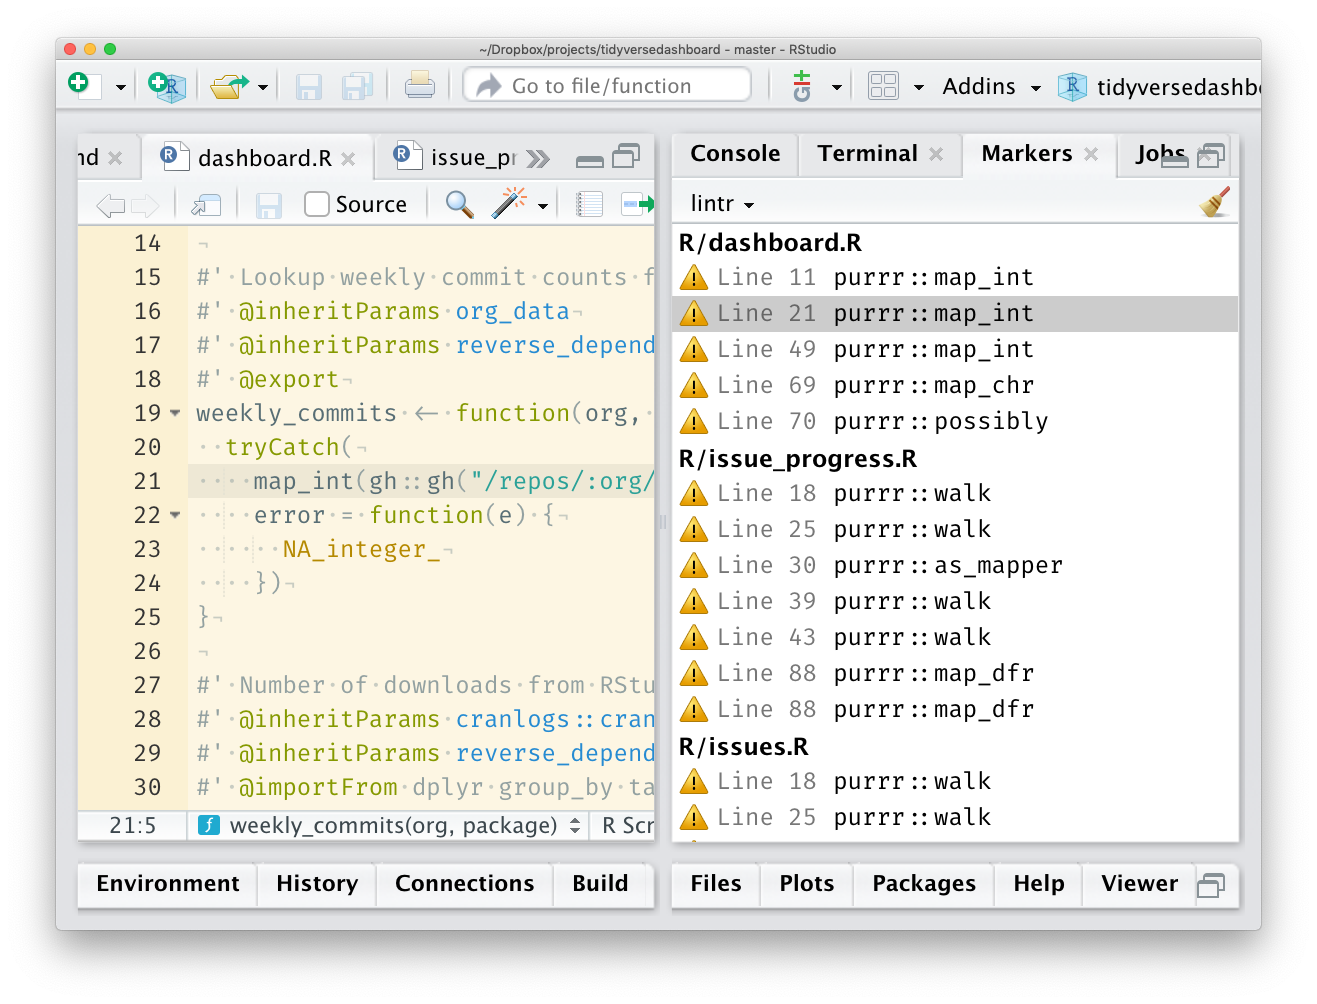
Then, use the dep_locate() function to find all the instances when you use
functions from a given dependency in your code base. If dep_locate() is run
in RStudio the function will add source markers for all the locations, which
can then be clicked individually to do the replacement.
itdepends::dep_locate("purrr", path = "~/p/tidyversedashboard")
Be balanced and use data
In almost any area of life striving towards absolutes rarely provides the best outcome. Package dependencies are no exception. Keep the expected users of your package in mind, and use the tools provided in itdepends to obtain data which can help you assess which dependencies to remove (if any).
Donald Knuth has great advice about the importance of measurement during performance optimization
Programmers waste enormous amounts of time thinking about, or worrying about, the speed of noncritical parts of their programs, and these attempts at efficiency actually have a strong negative impact when debugging and maintenance are considered. We should forget about small efficiencies, say about 97% of the time: premature optimization is the root of all evil. Yet we should not pass up our opportunities in that critical 3%.
Performance optimization is important, but we should not seek to optimize it until we have measured our program to see where the this critical 3% lies. The same is true of dependencies, lowering the dependencies is important for some packages, however we should not do so blindly without identifying if it is truly necessary and measuring to discover what the most critical dependencies are.
Finally it is important to remember Goodhart’s Law
When a measure becomes a target, it ceases to be a good measure.