
We’re thrilled to announce that vdiffr 0.3.0 is now on CRAN! vdiffr is a testthat extension that makes it easy to add visual unit tests for R plots. Testing visualisations is hard because it is difficult to integrate in an automated workflow. vdiffr achieves this by generating SVG renditions of your plot, storing them in the tests/fig folder in your package, and comparing the SVGs when running the tests. If you’re developing a package for statistical graphics, you might be interested in adding vdiffr to your checking workflow.
This is the first publicly announced version of vdiffr because previous versions had issues with the comparison of SVGs across platforms, such as Travis or the CRAN machines. These problems should now be fixed. If you’re already a vdiffr user, please note that you will need to regenerate all your figures with the new SVG generation engine.
Create visual unit tests
expect_doppelganger() is the main function you’ll be using to create visual unit tests. It accepts three types of input:
ggplot2 objects, which are specially integrated in vdiffr (see below).
More generally, any object whose
print()method draws the object on the graphics device.Functions. Those will be called by vdiffr and should print the plot as side effect.
Here is an example of how to use it:
context("Distributions")

test_that("histograms draw correctly", {
  hist_ggplot <- ggplot(mtcars, aes(disp)) + geom_histogram()
  vdiffr::expect_doppelganger("ggplot2 histogram", hist_ggplot)

  hist_base <- function() hist(mtcars$disp)
  vdiffr::expect_doppelganger("Base graphics histogram", hist_base)
})
The first argument of expect_doppelganger() is the plot title. It should be a description of what is being tested exactly by the plot. The title is also standardised (all special characters are converted to -) and used as a filename to store the visual case. In addition, the current testthat context (here, “Distributions”) is used as directory for all figures generated in that context. The example above creates two visual tests whose whose saved SVG files live (once validated) in tests/figs/distributions/ggplot2-histogram.svg and tests/figs/distributions/base-graphics-histogram.svg.
vdiffr treats ggplot2 figures specially. First, it adds the figure title as ggtitle() (if the plot does not already have one). This makes the test figure self-explanatory when you open the SVG file. Secondly, if the plot does not have a ggplot2 theme, a minimalistic testing theme is automatically applied to it. This theme will not be tweaked in future ggplot2 versions to ensure some stability to the visual unit tests.
Manage visual tests with a Shiny app
New visual expectations must be validated first. To validate new figures, call vdiffr::manage_cases() or use the RStudio Addin installed by vdiffr. This opens a Shiny app that you will use to
validate the figures of new visual expectations.
Once the figures are validated, run devtools::test() in the usual way to run the visual tests. If the figure generated during the test doesn’t match its recorded version, testthat fails (but not on CRAN, see next section).
When testthat reports that a visual comparison fails, open the Shiny app again. The app features several diffing widgets to help you compare the figures and detect why they don’t match. You can also revalidate the figure if the failure is the result of fixing a bug, adding a feature, or some other benign upstream change that caused a change in the appearance of your figure.
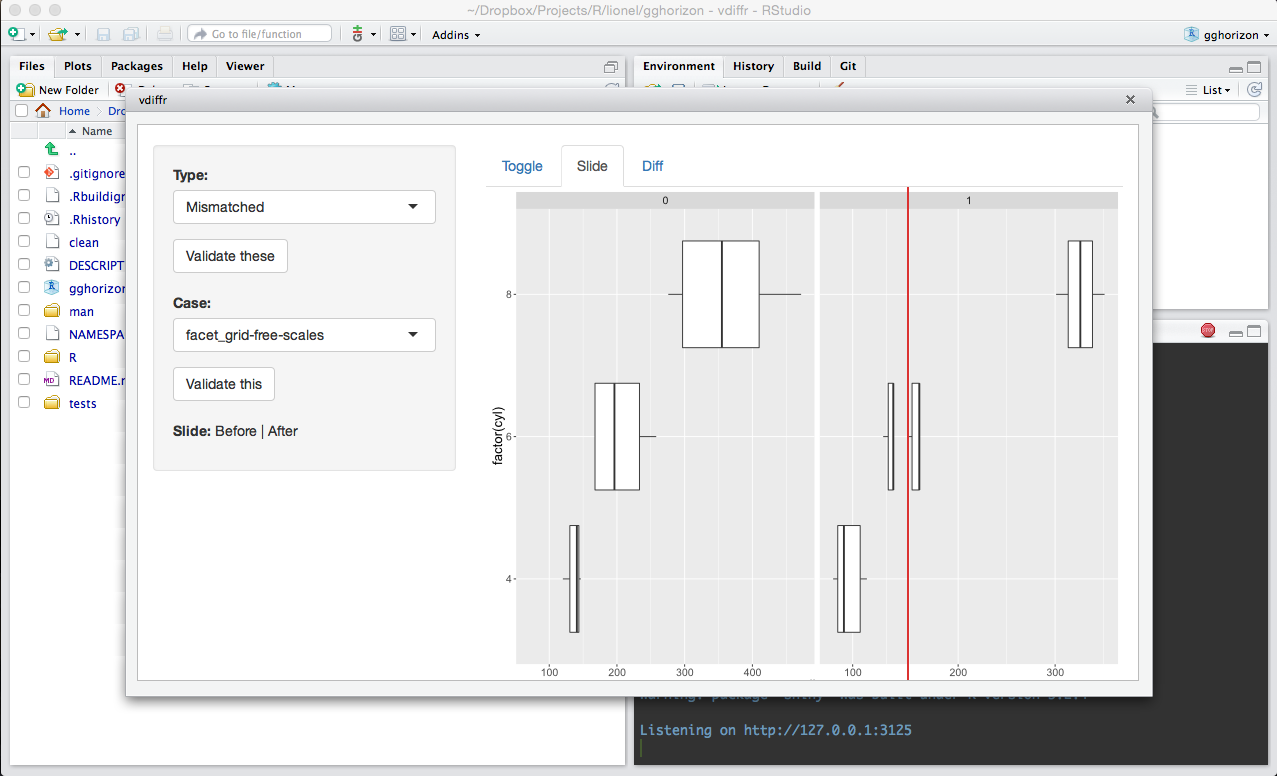
vdiffr in RStudio
Testing versus Monitoring
When a figure doesn’t match its saved version, it is only reported as a failure under these circumstances:
When the
NOT_CRANenvironment variable is set. Note that devtools sets this automatically when the tests are run interactively.On Travis, Appveyor, or any environment where the
Sys.getenv("CI")is set.
Otherwise, the failure is ignored. The motivation for this is that vdiffr is a monitoring tool and shouldn’t cause R CMD check failures on the CRAN machines.
This behaviour is motivated by the inherent fragility of visual comparisons. The exact way plots are rendered depends on a lot of upstream logic, such as the way margins are computed. vdiffr uses a special ggplot2 theme that should change very rarely, but there are just too many upstream factors that could cause breakages. In the end, visual testing is not an alternative to writing unit tests for the internal data transformations performed during the creation of your figure. It is more of a monitoring tool that allows you to quickly check how the appearance of your figures changes over time, and to manually assess whether changes reflect actual problems in your packages.
If you need to override the default vdiffr behaviour on CRAN (not recommended) or Travis (for example to run the tests in a particular builds but not others), set the VDIFFR_RUN_TESTS environment variable to “true” or “false”.