
One of the biggest changes in ggplot2 3.0.0 is support for tidy evaluation, making it more programmable, and more consistent with the rest of the tidyverse. Though this introduces some breaking changes, we believe it to be worthwhile in the interest of improving future code. Here we show a couple of examples of how you might use it. New developer facing changes are also discussed (see below).
Tidy aesthetics with aes()
You can now use
quasiquotation in
aes(),
facet_wrap(), and
facet_grid(). For aes(), quasiquotation (!!, !!!, :=) replaces
aes_() and
aes_string() (though these functions are being soft deprecated, and will be around for a while).
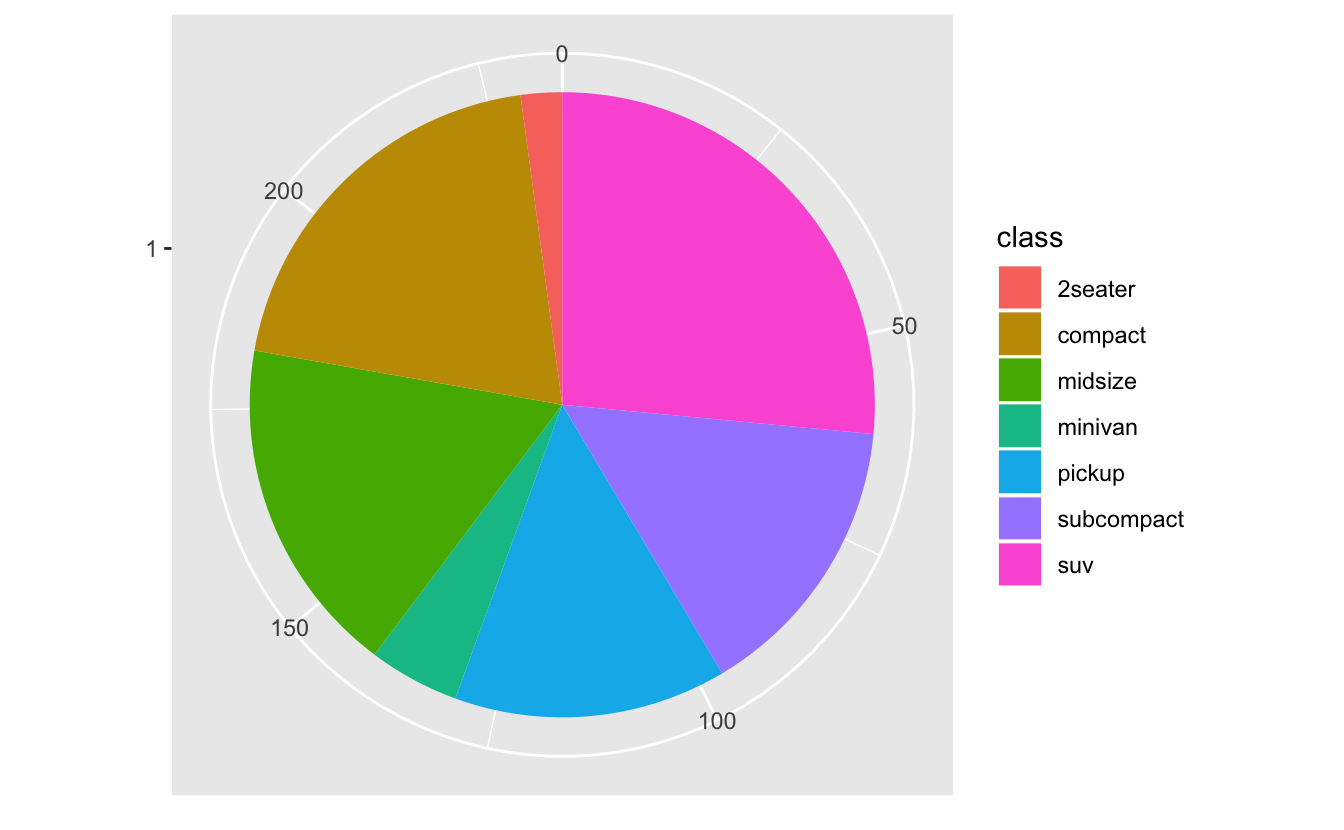
Here we’ll use quasiquotation to make a function to make a pie chart that allows the user to avoid using quotation marks when they pass their arguments to the function.1 The initial function, below, would require that the user know the exact specifications to pass to aes().
piechart_basic <- function(data, mapping) {
  ggplot(data, mapping) +
    geom_bar(width = 1) +
    coord_polar(theta = "y") +
    xlab(NULL) +
    ylab(NULL)
}
piechart_basic(mpg, aes(factor(1), fill = class))

The key to calling a tidy evaluation function inside of another function is to quote (with enquo()) and unquote (with !!):
pie_chart <- function(data, var, ...) {
  var <- enquo(var)
  piechart_basic(data, aes(factor(1), fill = !!var))
}
pie_chart(mpg, class)
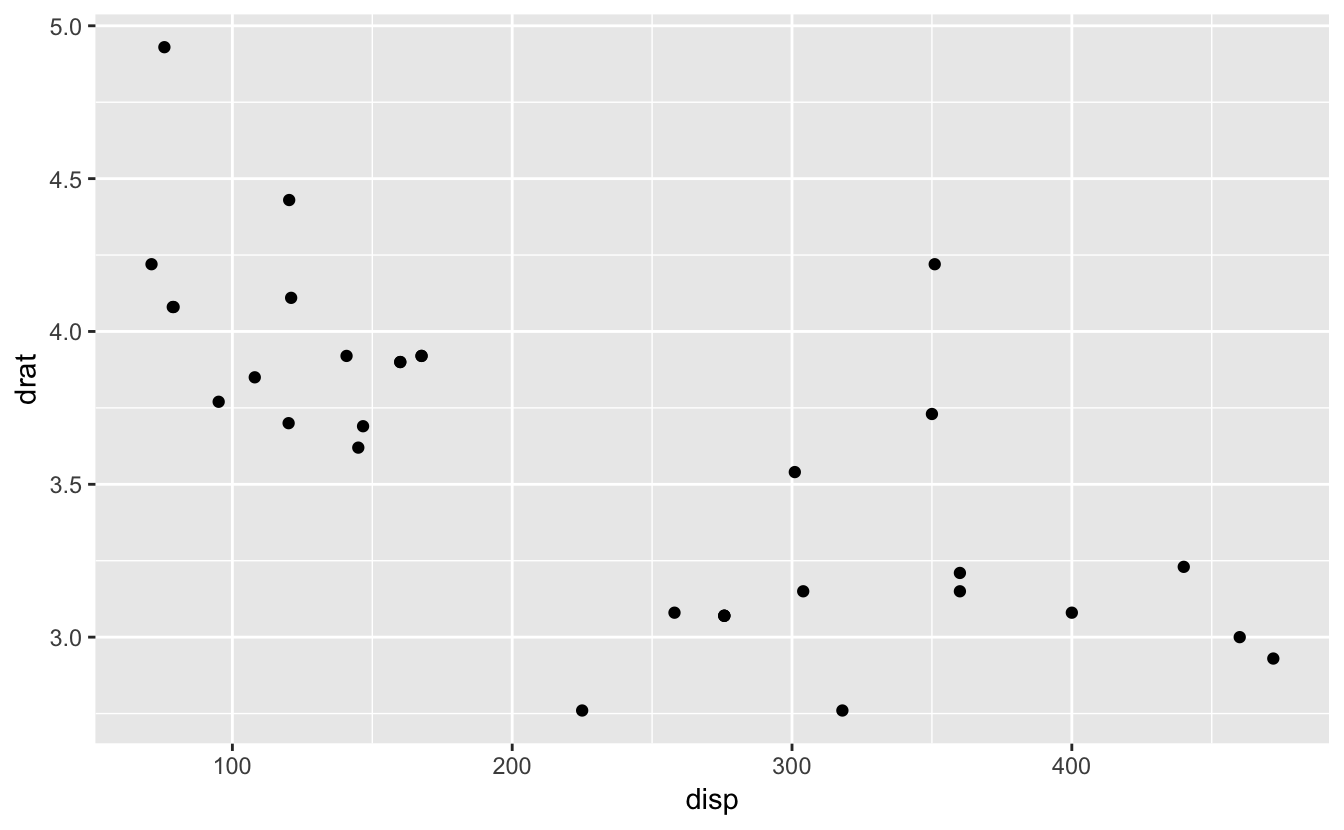
We could use this same pattern to make a scatterplot:
scatter_plot <- function(data, x, y) {
  x <- enquo(x)
  y <- enquo(y)

  ggplot(data) + geom_point(aes(!!x, !!y))
}
scatter_plot(mtcars, disp, drat)
Tidy facets with vars()
To support quasiquotation in facetting, we’ve added a new helper function:
vars(), short for variables. Instead of facet_grid(x + y ~ a + b) you can now write facet_grid(vars(x, y), vars(a, b)). The formula interface won’t go away; but the new vars() interface supports tidy evaluation, so can be easily programmed with.
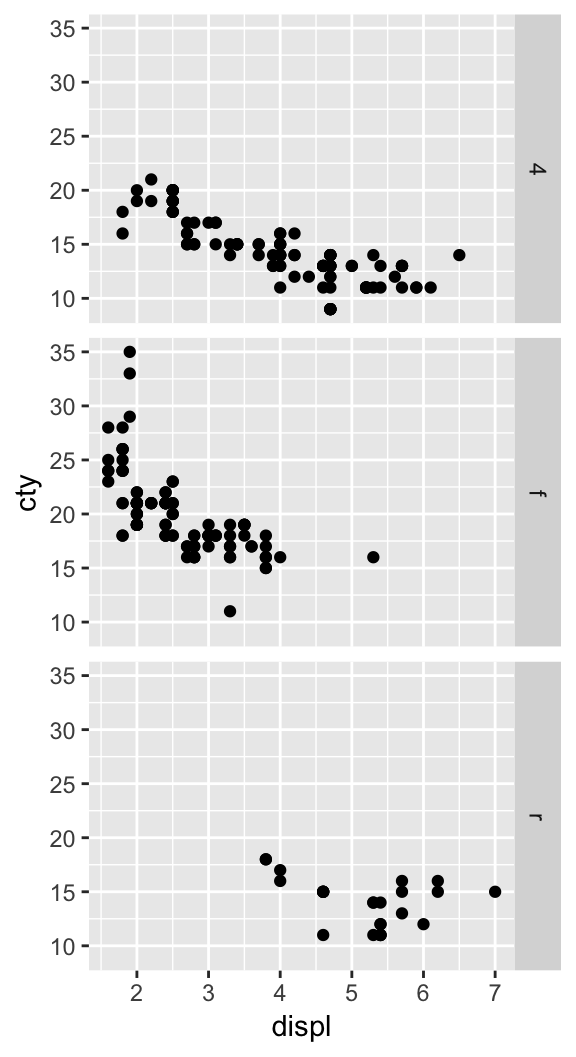
vars() is used to supply variables or expressions, evaluated in the context of the dataset to form facetting groups.
p <- ggplot(mpg, aes(displ, cty)) + geom_point()

p + facet_grid(rows = vars(drv))
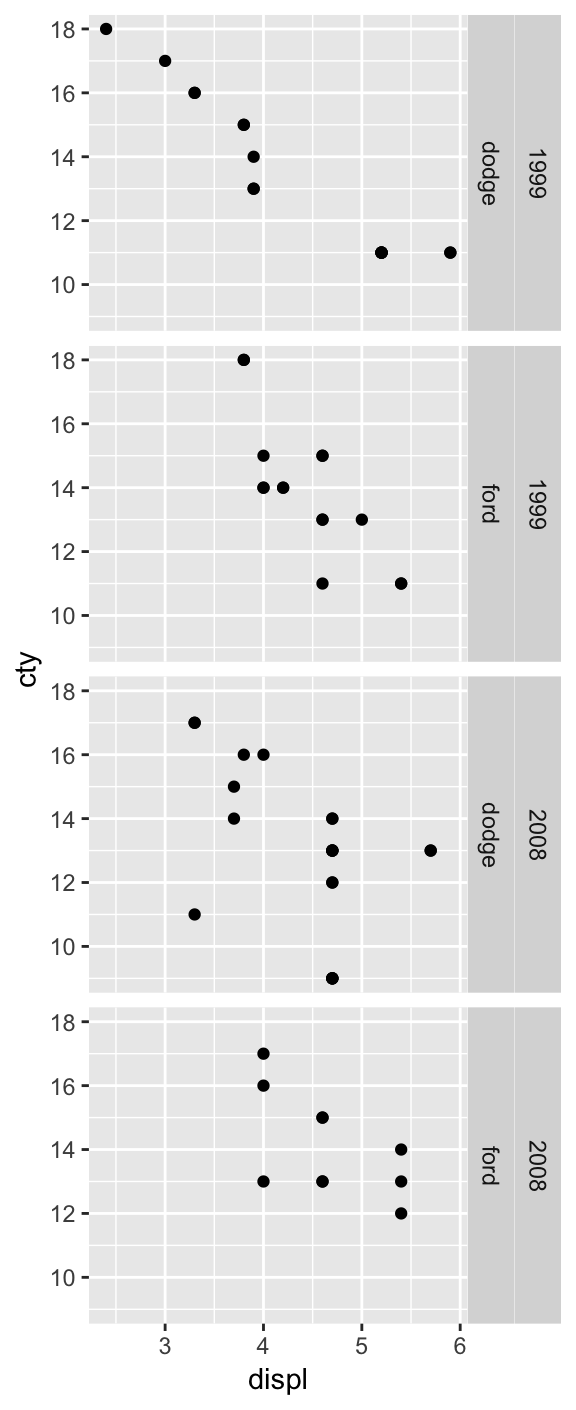
Compared to aes(), vars() takes unnamed arguments. This makes it a more
natural fit for use with !!!, the unquote-splice operator.
year <- 2018

d <- mpg %>%
  filter(manufacturer %in% c("dodge", "ford")) %>%
  ggplot() +
    geom_point(aes(displ, cty))

args <- quos(year, manufacturer)

d + facet_grid(vars(!!!args))
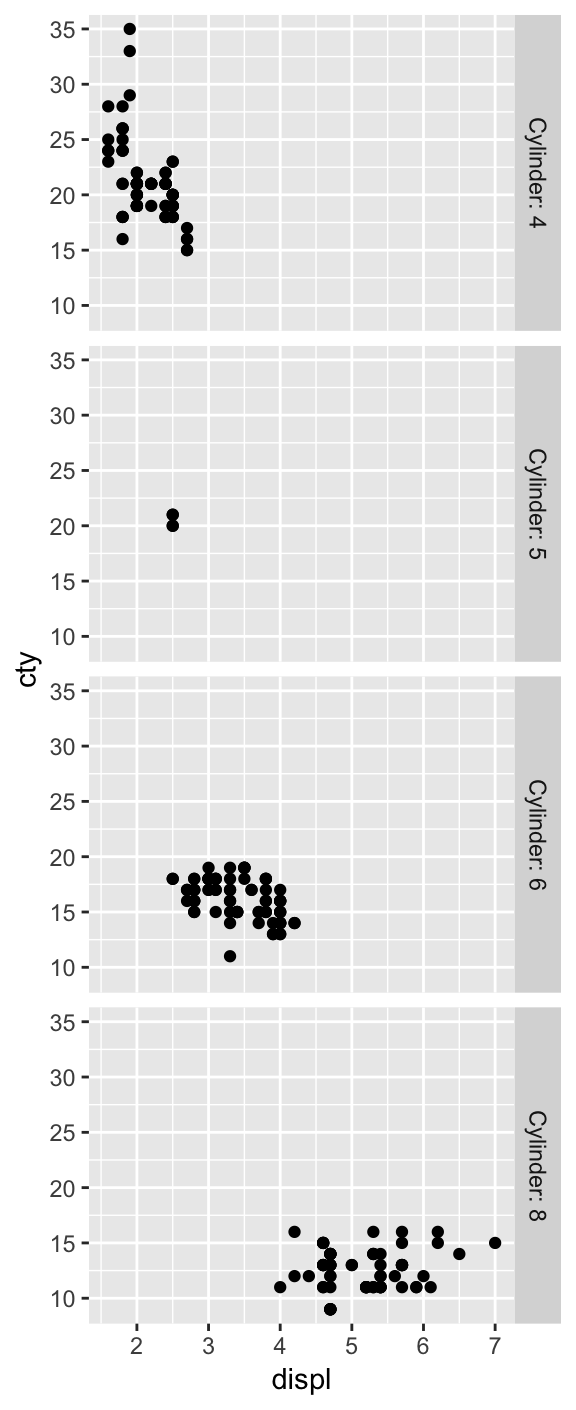
Inside of vars() you can easily supply names, which will add titles to the facets.
p + facet_grid(vars(Cylinder = cyl), labeller = label_both)
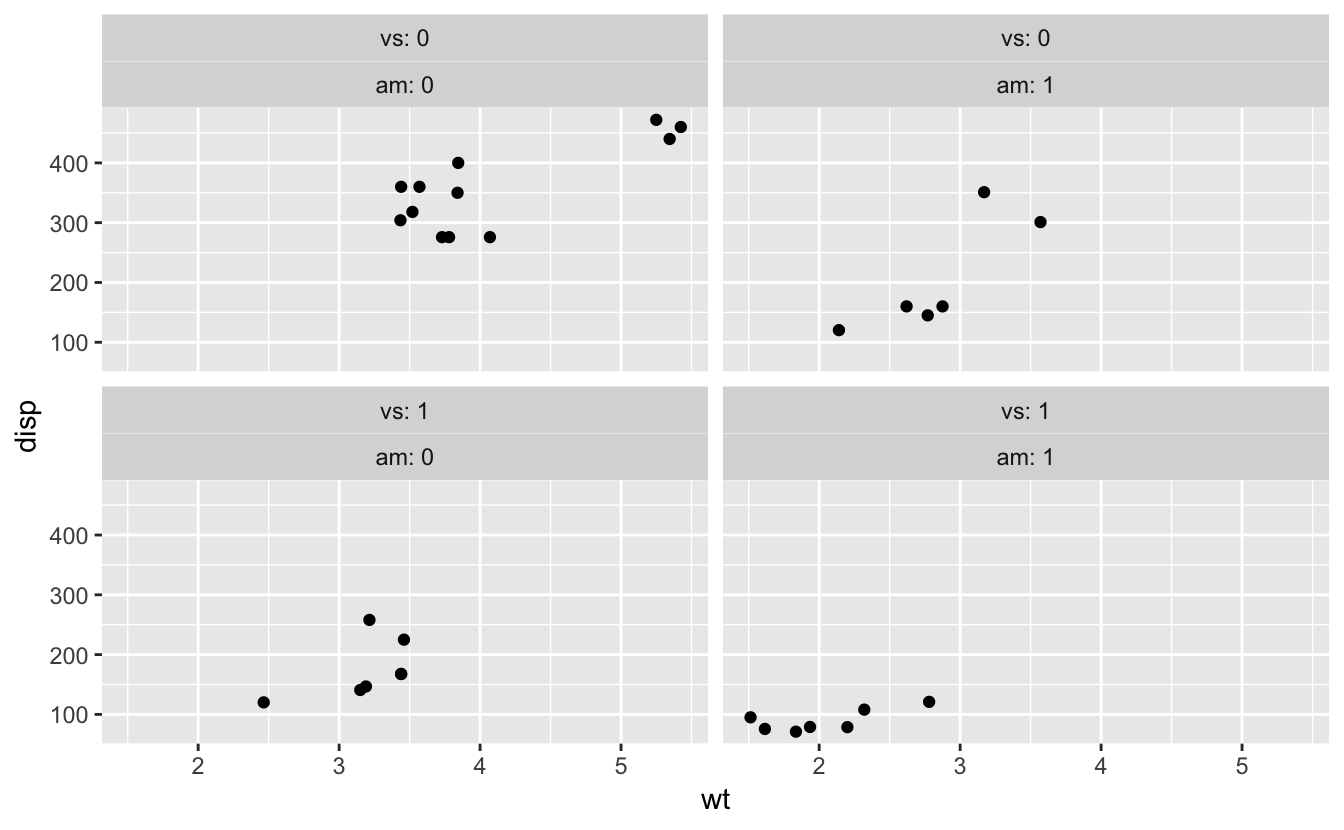
vars() makes it easier to pass variables from wrapper functions.
p <- ggplot(mtcars, aes(wt, disp)) + geom_point()

wrap_by <- function(...) {
  facet_wrap(vars(...), labeller = label_both)
}

p + wrap_by(vs, am)
In our wrap_by() function above, we used tidy dots (
...), which represent an arbitrary number of additional arguments. Alternatively, we could allow the user to provide a single named argument with
enquo(). To create a default name, we’ll use
quo_name(), which transforms a quosure into a simple string. Then we unquote and evaluate our arguments in their proper contexts using the
!! (read: bang bang) operator, and the := operator to unquote the name.
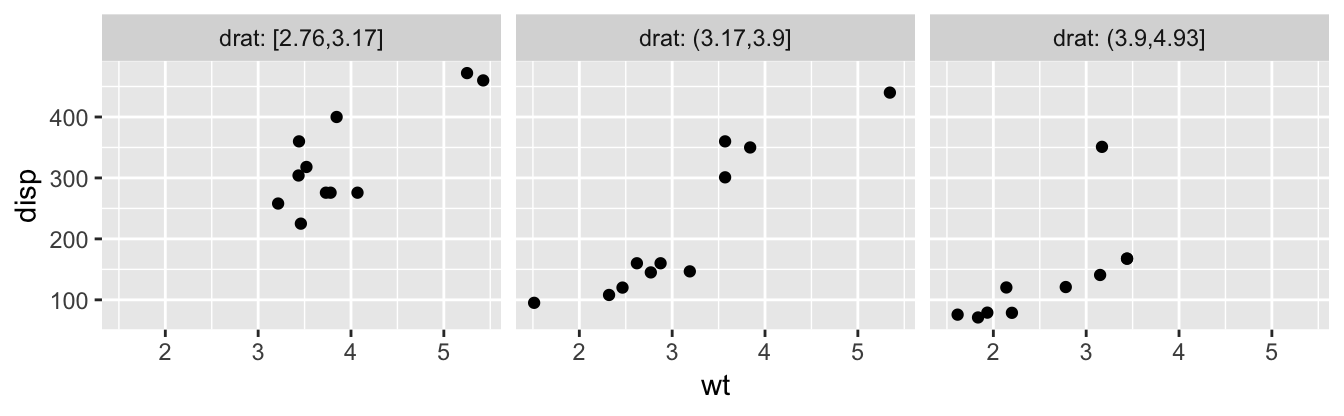
wrap_cut <- function(var, n = 3) {
  var <- enquo(var)
  nm <- quo_name(var)
  wrap_by(!!nm := cut_number(!!var, !!n))
}

p + wrap_cut(drat)
You will also need to use rlang tools if computing on the mapping of an existing ggplot2 object.
Developer facing changes
If you’re building an extension package on top of ggplot2, you need to be aware that the introduction of tidy evaluation fundamentally changes the data structures that aes() uses. In brief:
mapping <- aes(mpg, colour = "smoothed")

# Variables are now stored as quosures
mapping$x
#> <quosure>
#>   expr: ^mpg
#>   env:  global

# Constants (atomic vectors of length 1), remain
# as is
mapping$colour
#> [1] "smoothed"
Getting help
If you’re new to tidy evaluation, the best place to learn more about it is in the work-in-progress 2nd edition of Advanced R, especially the Metaprogramming section. You may also want to check out RStudio’s tidy evaluation webinar with Lionel Henry, or (if you’re short on time) Hadley’s video: Tidy evaluation in 5 minutes.
You can also always ask for help at community.rstudio.com.
Wickham, Hadley. 2016. “Programming with Ggplot2.” In Ggplot2: Elegant Graphics for Data Analysis, 241–53. Cham: Springer International Publishing. doi:10.1007/978-3-319-24277-4_12. ↩︎