
Announcing version 1.2.2 of the pillar package which prints tibbles to the terminal. This is yet another small release that addresses user feedback. Numbers are printed more consicely and accurately. We show how to enable the original data frame printing for tibbles, and an outlook on upcoming formatting improvement for list columns.
Please see the release notes for the full list of changes. Examples in this blog post are shown using the tibble package, which uses pillar under the hood.
Improved output
The decimal dot that was always printed since pillar 1.2.1 seems to have contributed to more confusion, not less. It’s gone now, whole numbers don’t have the dot anymore. Unless.
Unless it’s a whole number a tiny number has been added to or subtracted from. In other words, 1 is shown as 1, but 1 + 1e-6 is shown as 1.00, and 123 + 1e-6 is shown as 123.. This is a hint that there’s more than can be shown with the requested number of significant digits (which is 3 by default and can be changed by setting the pillar.sigfig option).
Likewise, decimal numbers that don’t use the requested number of significant digits are shortened. The number 0.1 is no longer shown as 0.100. Because most finite decimal representations don’t have an accurate representation in the underlying floating-point format, pillar uses a heuristic: if the number multiplied by a power of 10 is a whole number within a small tolerance of about 1e-8 (on most systems), it can be shortened. This is the same tolerance that the all.equal() function uses for comparing numeric values.
tibble(numbers = c(1, 0.1, 0.01, c(1, 12, 123, 1234, 0.1, 0.01) + 1e-6))#> # A tibble: 9 x 1 #> numbers #> <dbl> #> 1 1 #> 2 0.1 #> 3 0.01 #> 4 1.00 #> 5 12.0 #> 6 123. #> 7 1234. #> 8 0.100 #> 9 0.0100
Don’t like the printing?
Just like with the absence of row names or the default drop = FALSE, tibbles are opinionated in how they print. We’re working on providing a sensible default that suits most use cases, but some users have expressed the desire to revert to the good old data frame output.
This is possible already by overriding the print.tbl_df method, which is called when a tibble is printed (either explicitly via print() or implicitly from the console). On the downside, this also loses the second header row with the data types and the restriction in the number of rows and columns shown.
tibble(a = 1:3)#> # A tibble: 3 x 1 #> a #> <int> #> 1 1 #> 2 2 #> 3 3
print.tbl_df <- function(x, ...) {
  print.data.frame(x, ...)
  invisible(x)
}
tibble(a = 1:3)
#> a #> 1 1 #> 2 2 #> 3 3
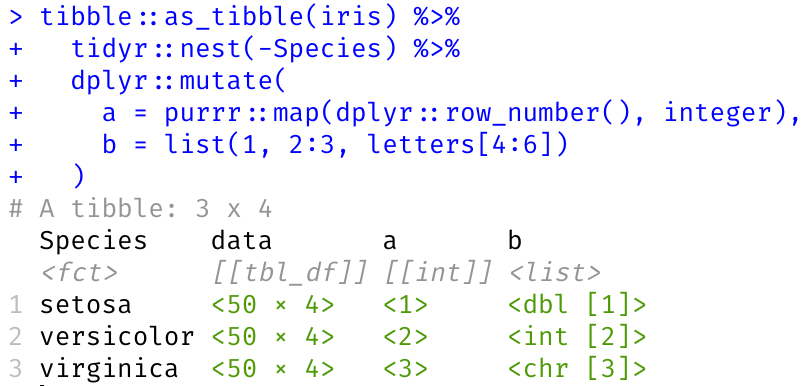
Outlook: formatting list columns
List columns (and the special case of nested data frames) are a very powerful idiom. In R, a list is just a special case of a vector that can hold arbitrary complex objects; it can be added to a data frame if it has the same lengths as the other columns:
tibble(a = 1:3, b = list(4, 5:6, letters[7:9]))#> # A tibble: 3 x 2 #> a b #> <int> <list> #> 1 1 <dbl [1]> #> 2 2 <int [2]> #> 3 3 <chr [3]>
Often, all objects in a list column have the same data type. A different formatting for such homogeneous lists would help focus on the relevant parts (e.g. the dimensions of the objects in that list) and save space too. This feature isn’t ready for prime time yet, but the screenshot below shows how this could look like. Feel free to comment on the relevant pull request on GitHub.
Acknowledgments
We’d like to use the opportunity to thank all recent contributors to pillar and tibble. Thanks to everyone, your contributions help improve the tidyverse:
@adsaxon, @aegerton, @alaindanet, @alexwhan, @alistaire47, @anhqle, @batpigandme, @bgreenwell, @blueprint-ade, @brodieG, @BruceZhaoR, @cboettig, @chasemc, @cimentadaj, @czeildi, @DavisVaughan, @digital-dharma, @dpeterson71, @drewgendreau, @echasnovski, @EdwardJRoss, @edzer, @Eluvias, @flying-sheep, @gregorp, @holstius, @hplieninger, @ijlyttle, @iron0012, @javierluraschi, @jcpetkovich, @jennybc, @JLYJabc, @jonathan-g, @jtelleriar, @kendonB, @kevinushey, @kevinykuo, @khughitt, @kovla, @lbusett, @lionel-, @lorenzwalthert, @lpmarco, @lwiklendt, @martinjhnhadley, @martj42, @mattfidler, @mmuurr, @momeara, @mubeenarasack, @mundl, @nathancday, @p0bs, @PalaceChan, @patperry, @plantarum, @PMassicotte, @randomgambit, @rkahne, @slonik-az, @strengejacke, @sumtxt, @t-kalinowski, @Tazinho, @tjmahr, @tmelconian, @tomroh, @trinker, @vnijs, @vspinu, @WB-Student, @wch, @wibeasley, @wpetry, @yutannihilation, and @Zedseayou.